BaseFit case study: electrifying an urban fleet does not start with buying vans
14 May 2026
A fleet can look easy to electrify from a distance: reasonable daily mileage, urban routes, vehicles returning to a depot and the possibility of charging overnight. The difficulty appears when the real operation is analysed in detail.
It is not enough to ask how many kilometres each vehicle travels. Routes, stops, payload, volume, duration, temperature, elevation, average speed, charging windows, available power, chargers, battery degradation and operating margin all have to be assessed together. The analysis must also show what happens when the day is not ideal.
This case study uses simulated but realistic data from an urban and peri-urban delivery company operating from a single depot. The results were calculated with Autonality’s BaseFit backend and Route Energy engine, using a model that estimates energy demand by route and then assesses vehicle-route fit, depot capacity and stress scenarios.
The conclusion is not simply “yes” or “no”. It is more useful than that: which part of the operation can be electrified first, which part requires operating discipline, which part should not be electrified yet and which depot investment is preventing the next phase.
1. Case context
The simulated company operates from a depot near Zaragoza and provides urban and peri-urban distribution for several types of customer: city-centre deliveries, pharmacies, HoReCa, light parcels, out-of-home delivery points, urgent spare parts and high-value regional routes.
The current fleet consists of 18 diesel vehicles. They do not all perform the same work. Some routes are short and stop-intensive, others are longer, some carry more payload, others require more cargo volume, and several depend on strict delivery or return times.
The company wants to assess a first electrification phase without compromising daily vehicle availability. It does not want to replace the entire fleet at once. It wants to know:
- which routes have a strong electric fit;
- which vehicle fits each route family best;
- whether the depot can recover the required energy overnight;
- how many electric vehicles can be introduced without major electrical work;
- which routes should remain diesel-powered or be redesigned;
- what happens in cold weather, under high payload or when one charger fails.
2. Depot data
The depot has 95 kW of contracted power. Of this, 32 kW is estimated as the site’s base load for warehouse activity, cold rooms, offices, lighting, forklifts and other consumption. The power effectively available for vehicle charging is therefore limited to 63 kW.
The overnight charging window runs from 21:30 to 05:30, providing 8 hours. The site has four 22 kW AC chargers. On paper, this might appear to provide 88 kW of installed charging power, but the actual limit is set by available site power and effective charger utilisation.
| Parameter | Value used |
|---|---|
| Contracted power | 95 kW |
| Site base load | 32 kW |
| Power available for charging | 63 kW |
| Existing chargers | 4 × 22 kW AC |
| Charging window | 21:30–05:30 |
| Effective duration | 8 h |
| Charger utilisation | 82% |
| Charging efficiency | 90% |
| Deliverable overnight energy | 453.6 kWh |
This is not a depot starting from zero. In fact, for many small or medium-sized urban fleet operations, having four 22 kW AC chargers already installed would be a reasonably strong starting point. Many companies begin with one or two charging points, or with no dedicated infrastructure at all.
That is precisely what makes the case relevant: even with a reasonable initial charging setup, the real question is not how many chargers are installed on paper, but how much energy the depot can reliably deliver every night without putting the operation under pressure.
3. Operating assumptions
The assessment uses a five-year horizon. Annual battery degradation, route margin, winter penalty and charging efficiency are included. The result is not calculated only from the vehicle’s range when new, but with a conservative operating margin.
| Assumption | Value |
|---|---|
| Analysis horizon | 5 years |
| Route buffer | 15% |
| Annual battery degradation | 2.5% |
| Winter penalty | 12% |
| Minimum green margin | 25 km |
| Minimum yellow margin | 5 km |
| Opportunity charging allowed | yes |
4. Simulated routes
The routes were not defined simply as “one vehicle travels X kilometres”. They were grouped into operating families using median distance, P90 distance, stops, duration, payload, average speed, urban/motorway mix, elevation gain and temperature.
This structure makes the case more realistic. Two 120 km routes can have very different energy consumption and risk profiles if one includes 90 urban stops while the other involves motorway driving, elevation, higher payload or a late return.
| Route | Family | Days/week | Departure | Return | Median km | P90 km | P90 stops | Payload | Occupancy % | Speed km/h | Urban % | Motorway % | Elevation +m | Temp ºC |
|---|---|---|---|---|---|---|---|---|---|---|---|---|---|---|
| R01 | R01 Dense city centre | 6 | 06:35 | 14:10 | 58 | 76 | 104 | low | 35 | 18 | 96 | 0 | 160 | 12 |
| R02 | R02 Pharmacy and temperature-controlled | 6 | 06:20 | 13:50 | 74 | 92 | 61 | medium | 55 | 22 | 88 | 4 | 210 | 8 |
| R03 | R03 Northern industrial area | 5 | 07:05 | 15:20 | 96 | 123 | 49 | medium | 60 | 31 | 58 | 18 | 280 | 12 |
| R04 | R04 Urgent spare parts west | 6 | 08:00 | 17:35 | 128 | 164 | 46 | medium | 52 | 39 | 45 | 28 | 420 | 13 |
| R05 | R05 City-centre HoReCa food delivery | 6 | 06:10 | 15:10 | 83 | 112 | 74 | high | 78 | 20 | 90 | 2 | 240 | 10 |
| R06 | R06 Light parcels outskirts | 6 | 07:20 | 14:40 | 102 | 132 | 96 | medium | 48 | 28 | 72 | 12 | 300 | 14 |
| R07 | R07 Mixed regional route east | 5 | 06:50 | 16:45 | 156 | 198 | 42 | medium | 58 | 46 | 35 | 38 | 620 | 11 |
| R08 | R08 High-volume retail | 5 | 07:35 | 16:20 | 118 | 154 | 31 | high | 82 | 34 | 50 | 22 | 360 | 12 |
| R09 | R09 Locker and OOH point replenishment | 6 | 09:10 | 18:30 | 142 | 178 | 55 | medium | 62 | 32 | 62 | 18 | 390 | 14 |
| R10 | R10 Returns and second wave | 5 | 11:45 | 20:15 | 88 | 118 | 62 | medium | 50 | 24 | 78 | 8 | 250 | 15 |
| R11 | R11 Long regional high-value route | 4 | 06:30 | 18:40 | 188 | 236 | 25 | medium | 55 | 52 | 25 | 48 | 850 | 10 |
| R12 | R12 Heavy refrigerated peri-urban route | 5 | 05:55 | 15:55 | 134 | 172 | 43 | high | 86 | 33 | 55 | 24 | 520 | 7 |
5. Candidate vehicles
The study does not compare vehicles as though every model were suitable for every task. Each candidate has a usable battery capacity, charging power, payload, cargo volume, segment and baseline energy consumption. BaseFit then matches these data against each route.
| Candidate vehicle | Segment | Usable battery kWh | AC kW | DC kW | Payload kg | Volume m³ | Baseline consumption Wh/km |
|---|---|---|---|---|---|---|---|
| Peugeot E-Partner Long 800kg electric 100 kW (136 hp) | small-van | 50 | 11 | 100 | 559 | 4.4 | 215 |
| Renault Trafic Van E-Tech L1H1 52kWh | midsize-van | 52 | 22 | 50 | 1222 | 5.8 | 235 |
| BaseFit archetype medium refrigerated van 75kWh | midsize-van | 68 | 11 | 100 | 650 | 5.5 | 310 |
| Farizon SV SuperVan L2H2 82.88kWh | large-van | 82.88 | 11 | 140 | 1200 | 9.39 | 240 |
| Farizon SV SuperVan L3H3 106.35kWh | large-van | 106.35 | 11 | 120 | 1075 | 13 | 267 |
| Ford E-Transit 425 L3H2 Extended Range | large-van | 89 | 11 | 180 | 1429 | 13 | 330 |
These vehicles should be read as analysis candidates, not as a final purchase recommendation. A real decision would also require validation of the exact variant, availability, body conversion, homologation, final payload, tyres, telematics, maintenance and warranty policy.
6. Route-to-vehicle fit results
The first result shows that 10 of the 12 route families have at least one reasonable electric fit under baseline conditions. Eight are classified green, two yellow and two red.
| Route | Family | Best BaseFit candidate | Band | Score | P90 energy kWh | P90 margin km | Adjusted Wh/km |
|---|---|---|---|---|---|---|---|
| R01 | R01 Dense city centre | Peugeot E-Partner Long 800kg electric 100 kW (136 hp) | green | 100 | 33.68 | 25.96 | 290.4 |
| R02 | R02 Pharmacy and temperature-controlled | Farizon SV SuperVan L2H2 82.88kWh | green | 100 | 46.72 | 55.47 | 327.24 |
| R03 | R03 Northern industrial area | Farizon SV SuperVan L2H2 82.88kWh | green | 100 | 50.84 | 58.2 | 284.33 |
| R04 | R04 Urgent spare parts west | Farizon SV SuperVan L3H3 106.35kWh | green | 100 | 71.3 | 57.07 | 306.94 |
| R05 | R05 City-centre HoReCa food delivery | Farizon SV SuperVan L2H2 82.88kWh | green | 100 | 54.07 | 43.15 | 332.87 |
| R06 | R06 Light parcels outskirts | Farizon SV SuperVan L2H2 82.88kWh | green | 100 | 54.63 | 48.97 | 293.22 |
| R07 | R07 Mixed regional route east | Farizon SV SuperVan L3H3 106.35kWh | yellow | 69 | 90.45 | 12.38 | 324.94 |
| R08 | R08 High-volume retail | Farizon SV SuperVan L2H2 82.88kWh | yellow | 72 | 64.5 | 24.83 | 292.48 |
| R09 | R09 Locker and OOH point replenishment | Farizon SV SuperVan L3H3 106.35kWh | green | 100 | 75.87 | 47.48 | 307.8 |
| R10 | R10 Returns and second wave | Farizon SV SuperVan L2H2 82.88kWh | green | 100 | 52.87 | 49.16 | 313.67 |
| R11 | R11 Long regional high-value route | Peugeot E-Partner Long 800kg electric 100 kW (136 hp) | red | 0 | 92.05 | -120.16 | 262.47 |
| R12 | R12 Heavy refrigerated peri-urban route | Peugeot E-Partner Long 800kg electric 100 kW (136 hp) | red | 0 | 74.31 | -67.42 | 274.03 |
The quick interpretation would be: “there are plenty of green routes, so proceed”. But that conclusion would be incomplete.
There are three important qualifications:
- Green does not mean electrify everything tomorrow. It means there is a strong route-to-vehicle fit under the current assumptions.
- Yellow does not mean impossible. It means the route requires charging discipline, deviation control and operating margin.
- Red does not mean electric vehicles cannot work. It means that the route family, as currently designed, should not be electrified without redesign, intermediate charging, a different operating architecture or route-specific validation.
7. Which routes the depot would select today
Although 10 routes are compatible with at least one electric vehicle, the current depot cannot support all of them. Overnight charging capacity and available power constrain the first deployment.
BaseFit selects six route families first because they provide the best combination of operating fit, value, robustness and energy demand within the depot’s actual constraints.
| Route | Family | Assigned vehicle | Band | P90 kWh | Score |
|---|---|---|---|---|---|
| R01 | R01 Dense city centre | Peugeot E-Partner Long 800kg electric 100 kW (136 hp) | green | 33.68 | 100 |
| R02 | R02 Pharmacy and temperature-controlled | Farizon SV SuperVan L2H2 82.88kWh | green | 46.72 | 100 |
| R03 | R03 Northern industrial area | Farizon SV SuperVan L2H2 82.88kWh | green | 50.84 | 100 |
| R04 | R04 Urgent spare parts west | Farizon SV SuperVan L3H3 106.35kWh | green | 71.3 | 100 |
| R05 | R05 City-centre HoReCa food delivery | Farizon SV SuperVan L2H2 82.88kWh | green | 54.07 | 100 |
| R06 | R06 Light parcels outskirts | Farizon SV SuperVan L2H2 82.88kWh | green | 54.63 | 100 |
Energy required for this first deployment: 311.24 kWh/night.
Energy required to electrify all compatible routes: 594.93 kWh/night.
Overnight energy deliverable by the current depot: 453.6 kWh/night.
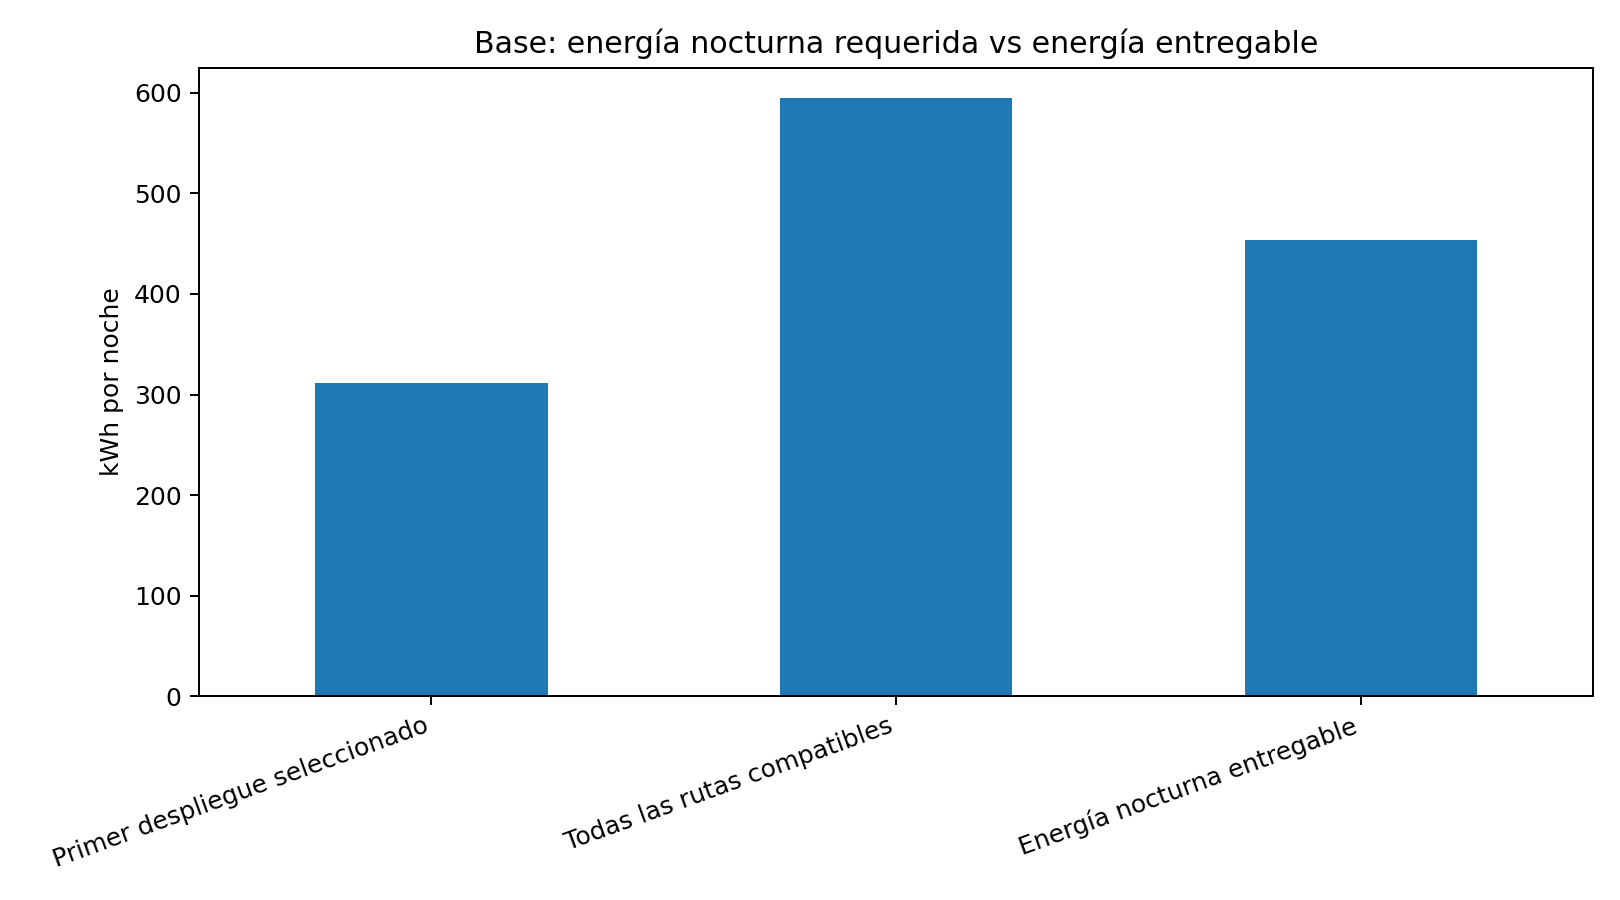
This difference changes the decision. The challenge is not finding an electric vehicle that can perform a route. The challenge is scaling the fleet without saturating the depot.
The four compatible routes left outside the first deployment are:
- R07 Mixed regional route east.
- R08 High-volume retail.
- R09 Locker and OOH point replenishment.
- R10 Returns and second wave.
They are not excluded because they are impossible to electrify. They are excluded because the current depot should not be pushed to its limit from day one.
8. The depot bottleneck
To electrify all compatible routes, the system calculates:
| Metric | Result |
|---|---|
| Compatible routes | 10 |
| EVs currently supported by the depot | 6 |
| Chargers required for all compatible routes | 7 |
| Existing chargers | 4 |
| Required contracted power | 106.37 kW |
| Current contracted power | 95 kW |
| Power gap | 11.37 kW |
| Energy required for all compatible routes | 594.93 kWh |
| Current deliverable energy | 453.6 kWh |
| Overnight energy gap | 141.33 kWh |
| Main bottleneck | power |
This reveals a common trap. Four 22 kW AC chargers may look like a generous installation for a first electrification phase. Compared with many real depots, it is. But installed charging power does not automatically equal operating capacity.
Once the site’s base load, contracted power, charging efficiency, actual utilisation, overnight window and P90 route energy are included, the picture changes. The current depot can support a reasonable first deployment. What it cannot support is the electrification of the entire compatible route block without increasing power, adding charging capacity or changing the operating plan.
9. Stress scenarios
Operations do not usually fail on an average day. They fail when several factors combine: cold weather, higher payload, longer routes, lower efficiency, a charger out of service or late returns.
BaseFit calculated four stress scenarios across the compatible routes:
| Scenario | Green | Yellow | Red | Viable | Depot bottleneck | EVs supported | Required kWh | Deliverable kWh | Failure |
|---|---|---|---|---|---|---|---|---|---|
| Demanding winter | 5 | 3 | 2 | No | power | 6 | 542.34 | 453.6 | both |
| High payload | 6 | 2 | 2 | No | chargers | 6 | 459.87 | 453.6 | both |
| One charger unavailable | 8 | 2 | 0 | No | power | 4 | 594.93 | 351.65 | depot |
| Winter with stressed operations | 0 | 0 | 10 | No | vehicles | 0 | 0 | 443.52 | route |
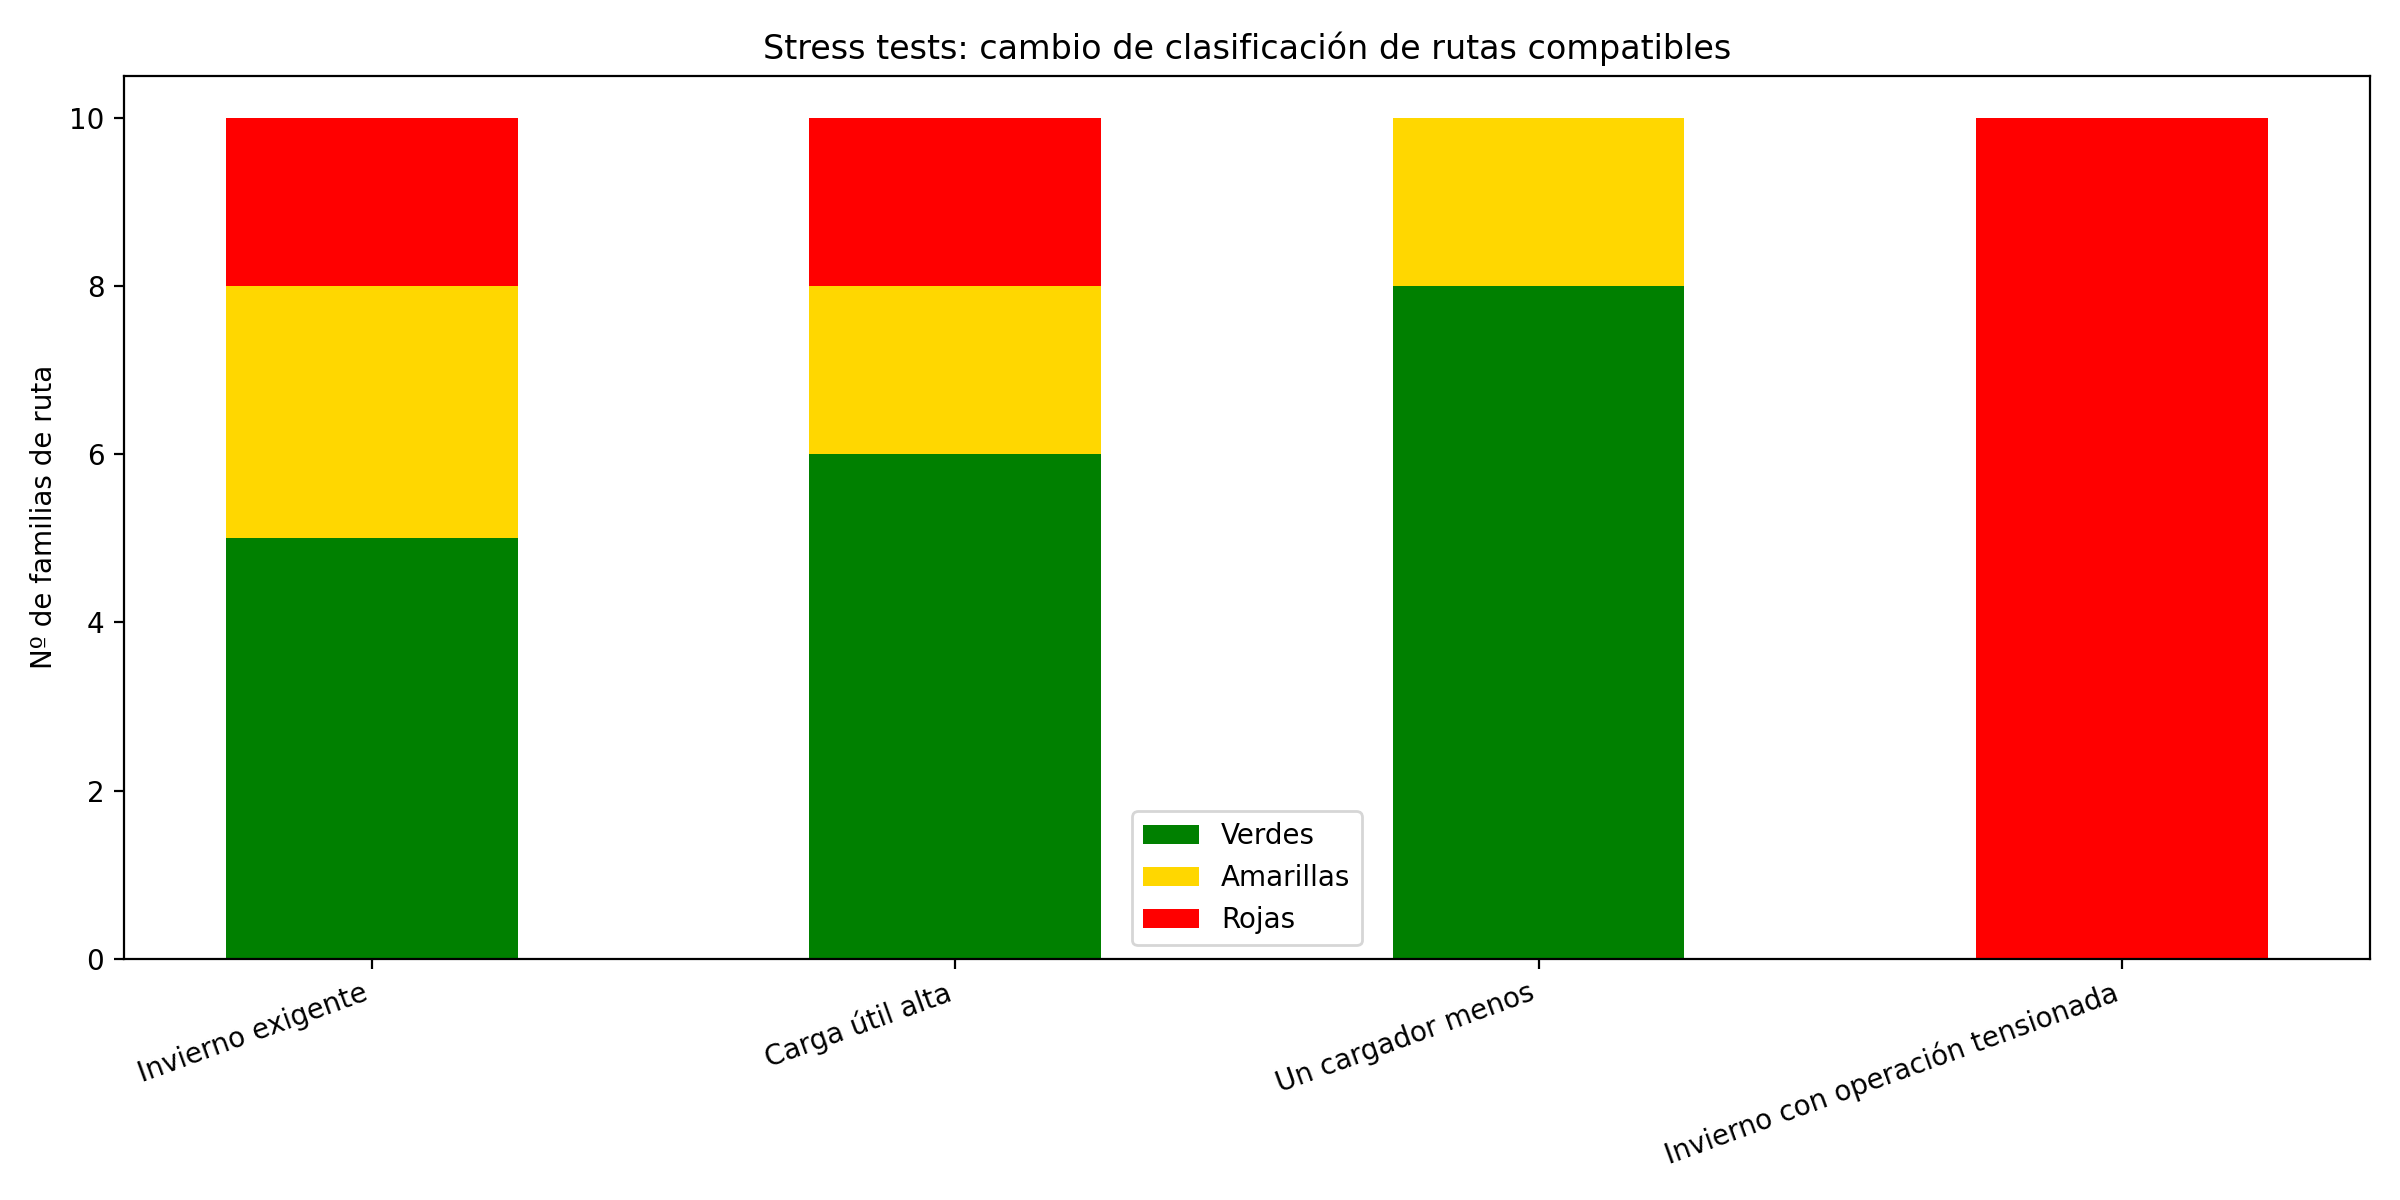
The most useful scenario is not necessarily the most extreme. It is the one that reveals where the operation breaks.
- Under a demanding winter scenario, several green routes move to yellow or red. The plan is no longer robust.
- Under high payload, some routes fail not only because of energy demand, but because of vehicle capacity.
- With one charger unavailable, the routes still fit the vehicles, but the depot can no longer sustain the plan.
- Under winter conditions combined with stressed operations, the system shows that the deployment should not be presented as resilient without additional operating rules.
10. How energy demand changes across the first deployment routes
The following table compares the P90 energy demand of the six routes selected for the first deployment under baseline conditions and under winter with stressed operations.
| Route | Family | Baseline kWh | Stressed winter kWh | Increase | Baseline band | Stress band | Stress margin km |
|---|---|---|---|---|---|---|---|
| R01 | R01 Dense city centre | 33.68 | 43.42 | 28.9% | green | red | 3.1 |
| R02 | R02 Pharmacy and temperature-controlled | 46.72 | 53.05 | 13.5% | green | green | 37.88 |
| R03 | R03 Northern industrial area | 50.84 | 63.42 | 24.7% | green | yellow | 22.26 |
| R04 | R04 Urgent spare parts west | 71.3 | 87.72 | 23.0% | green | yellow | 15.68 |
| R05 | R05 City-centre HoReCa food delivery | 54.07 | 67.83 | 25.4% | green | yellow | 11.66 |
| R06 | R06 Light parcels outskirts | 54.63 | 67.38 | 23.3% | green | yellow | 14.72 |
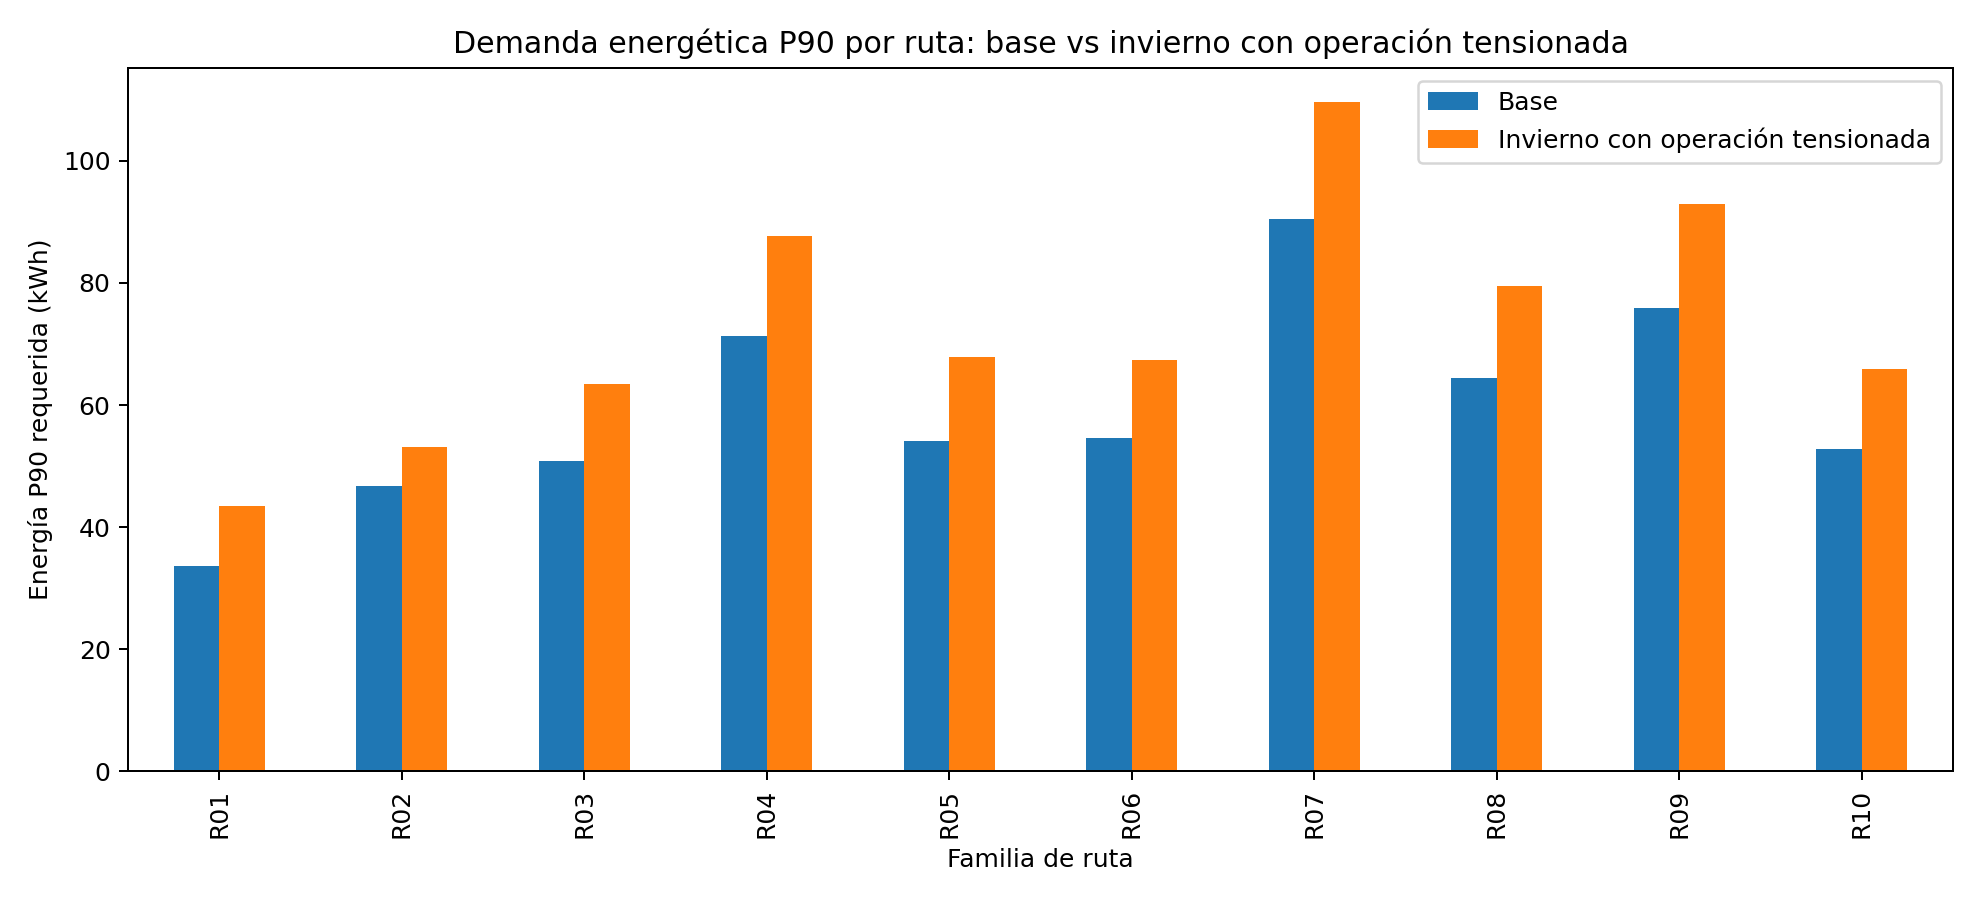
This is the type of result that a simple spreadsheet often hides. A route may appear green under average conditions and still lose its margin when cold weather, additional buffer, lower charging efficiency and a more demanding operation occur together.
R01 is a good example. Under baseline conditions, it looks like an ideal urban route for a small van: 58 median kilometres, a high density of stops and low payload. But under stressed winter conditions, the margin falls to 3.1 km and the route is no longer recommended with that assignment unless additional rules are introduced. The route is not inherently unsuitable. It simply should not be planned without sufficient margin.
11. Recommended decision
The recommended decision is not to electrify 10 routes, nor to wait until the depot is perfect. The reasonable decision is a first phase of six electric vehicles assigned to specific routes and governed by clear operating rules.
Recommended phase 1
Initially electrify:
- R01 Dense city centre.
- R02 Pharmacy and temperature-controlled.
- R03 Northern industrial area.
- R04 Urgent spare parts west.
- R05 City-centre HoReCa food delivery.
- R06 Light parcels outskirts.
Conditions for doing so:
- daily departure with a route-specific target SOC, not simply “plug in and hope”;
- real payload monitoring;
- review of mileage deviations;
- monitoring of late returns;
- a diesel substitution rule when the forecast margin falls below the threshold;
- charger monitoring and alerts when a charger does not deliver the expected power;
- validation over several weeks before expanding.
This phase consumes approximately 311.24 kWh/night, below the 453.6 kWh/night deliverable by the current depot. It is a defensible first phase.
Possible phase 2
After validating real operating data, the company could assess an expansion to R09 and R10, followed by a more careful analysis of R07 and R08.
However, to electrify all compatible routes, the backend calculates a requirement of approximately 106.37 kW of contracted power, compared with the current 95 kW, as well as additional charging capacity. The upgrade should not be decided by intuition, but from real pilot data.
12. What should not be electrified yet
The following routes should not be electrified yet:
R11 Long regional high-value route
This route has a median distance of 188 km, a P90 of 236 km, substantial motorway driving, significant elevation and a long working day. Although its business value may make it appear attractive, it is not a good first electric route. It should remain diesel-powered or be redesigned.
Options before electrifying it:
- split the route;
- introduce structured intermediate charging;
- review whether the actual return time enables a different charging window;
- assess a vehicle in another category;
- reduce variability or separate urgent deliveries.
R12 Heavy refrigerated peri-urban route
This route combines high payload, refrigeration demand, a P90 distance of 172 km, low temperature and elevation. The problem is not only battery capacity. Auxiliary loads, payload, body conversion and operating margin also matter.
Options before electrifying it:
- validate real refrigeration energy consumption;
- review body conversion and payload loss;
- separate heavy orders;
- assess shorter refrigerated routes;
- run an instrumented vehicle trial before purchasing.
R07 and R08 as first fixed electric routes
R07 and R08 are not impossible, but they are classified yellow. They should not be the first routes permanently assigned to EVs if the company does not yet have charging discipline, real-world data and a contingency plan. They could enter a controlled pilot, but not as a direct replacement from day one.
13. How to operate the fleet after deployment
Fleet electrification does not end when the vehicle is purchased. It begins when that vehicle has to leave the depot the next morning.
To operate the first phase, the company should introduce a daily routine:
Before the charging window
- confirm which routes the EVs will perform the following day;
- calculate required energy by route using expected distance, payload, temperature and margin;
- assign a charger and charging slot to each vehicle;
- validate that total energy demand fits within the available charging window;
- reserve diesel vehicles for red routes, stressed yellow routes or incidents.
During charging
- monitor the actual power delivered by each charger;
- detect chargers that fail to start or charge below the expected rate;
- recalculate vehicle availability if a vehicle does not reach its target SOC;
- prioritise vehicles by departure time and route criticality.
Before departure
- compare actual SOC against required P90 route energy;
- review payload and cargo volume;
- block assignments when operating margin falls below the threshold;
- activate an alternative vehicle when a relevant deviation is detected.
After the route
- compare estimated energy with actual energy consumption;
- review additional kilometres, duration, stops and return time;
- adjust consumption by route family;
- identify routes that move from green to yellow on specific days;
- decide whether a route can scale or should remain under observation.
14. Why this is difficult to solve with Excel
Excel can be useful for an initial approximation. It can add kilometres, average consumption and cost. But this case shows several problems that are difficult to manage reliably in a manual spreadsheet:
- each route has P50, P90, stops, payload, speed, temperature, elevation and an urban/motorway mix;
- each vehicle has battery capacity, payload, volume, consumption, AC/DC charging power and recommended operating limits;
- fit depends not only on energy, but also on payload, margin, battery degradation and operating use;
- the depot has contracted power, site base load, chargers, efficiency, utilisation and an overnight window;
- a green route may still be excluded from the first phase if the depot becomes saturated;
- an apparently easy route may fail under cold weather or high payload;
- losing one charger does not change the route, but it can break the depot plan;
- the optimum is not “the route with the fewest kilometres”, but the combination that maximises value without exceeding energy, charger and power constraints.
The decision is not purely mathematical. It is operational.
15. Executive result
Using the simulated data:
- 12 route families analysed.
- 6 candidate electric vehicles.
- 10 routes with at least one reasonable electric fit.
- 8 green routes under baseline conditions.
- 2 yellow routes.
- 2 routes not yet recommended for electrification.
- The depot can currently support a first phase of 6 EVs.
- Electrifying all compatible routes would require more contracted power and additional charging capacity.
- Stress scenarios show that the plan must be operated with rules, not only with theoretical vehicle range.
The recommendation is to begin with a controlled six-vehicle deployment, measure performance for several weeks and use real data to decide the next expansion. Anything else would confuse technical feasibility with operational robustness.
The electrification of an urban fleet should not begin with the question “which van should I buy?”. It should begin with a different question: which routes can I electrify tomorrow without disrupting the operation, using which vehicle, charging where, for how long and with what margin when conditions become more difficult?
That is the problem we are working to solve. To analyse a real operation using routes, vehicles, depot constraints, charging and stress scenarios, see how we work with BaseFit.